From 41% to 72% in four weeks: a trial process redesign with business analysis and AI
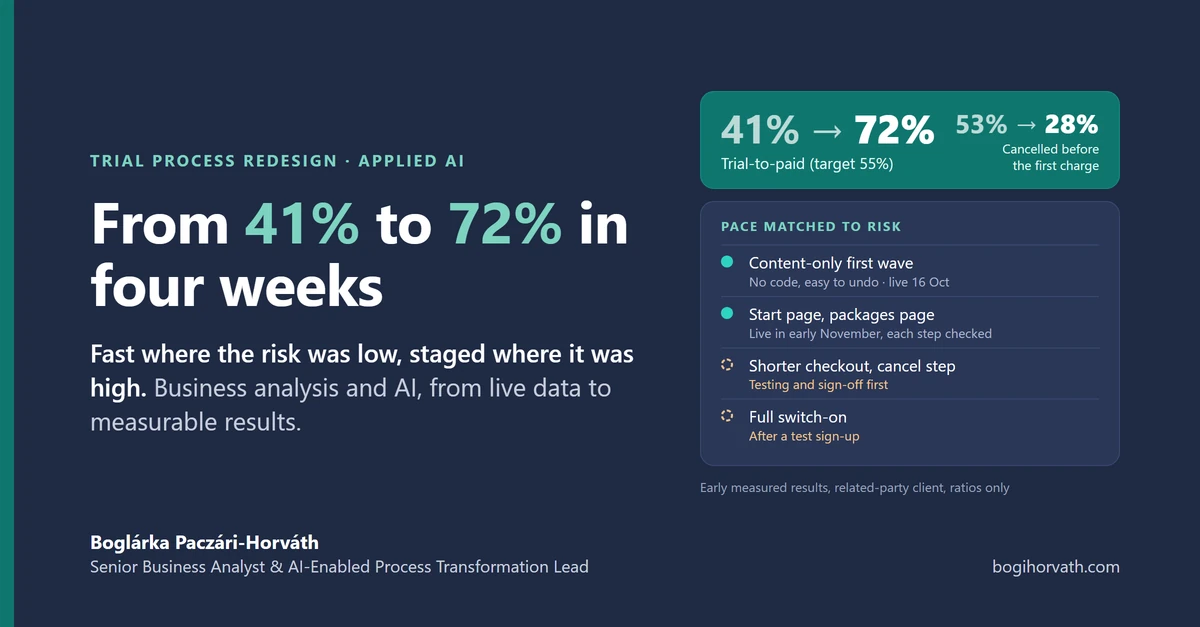
In my last article, "Rule, agent or human?", I argued that AI makes process improvement and business analysis faster without replacing either. This article shows the project behind that view: a trial process redesign for a SaaS company, which I diagnosed, redesigned and measured in less than four weeks.
The client is an AI-marketing SaaS and a related party, so I share ratios only. Its trial was losing customers at every stage. AI did the data pulls and the first drafts; I owned the method and the design, and shaped every decision with the client. The first release went live three days after the first data pull. It changed content only, so it carried little risk and was easy to undo; everything that touches code or payments is going live in stages, each one checked before the next. Within four weeks, the share of trial users who become paying customers rose from 41% to 72%.
Experience is what made that pace possible. I have 14+ years in enterprise business analysis and process transformation, and for the past year I have worked hands-on with applied AI, in a regulated enterprise and in a small company. That background tells me which questions to ask, which steps an AI can take over and what it needs to do each one well. In my view, this is the skill that matters most now: breaking the work into steps an AI can perform, then giving the AI what each step needs.
The starting point
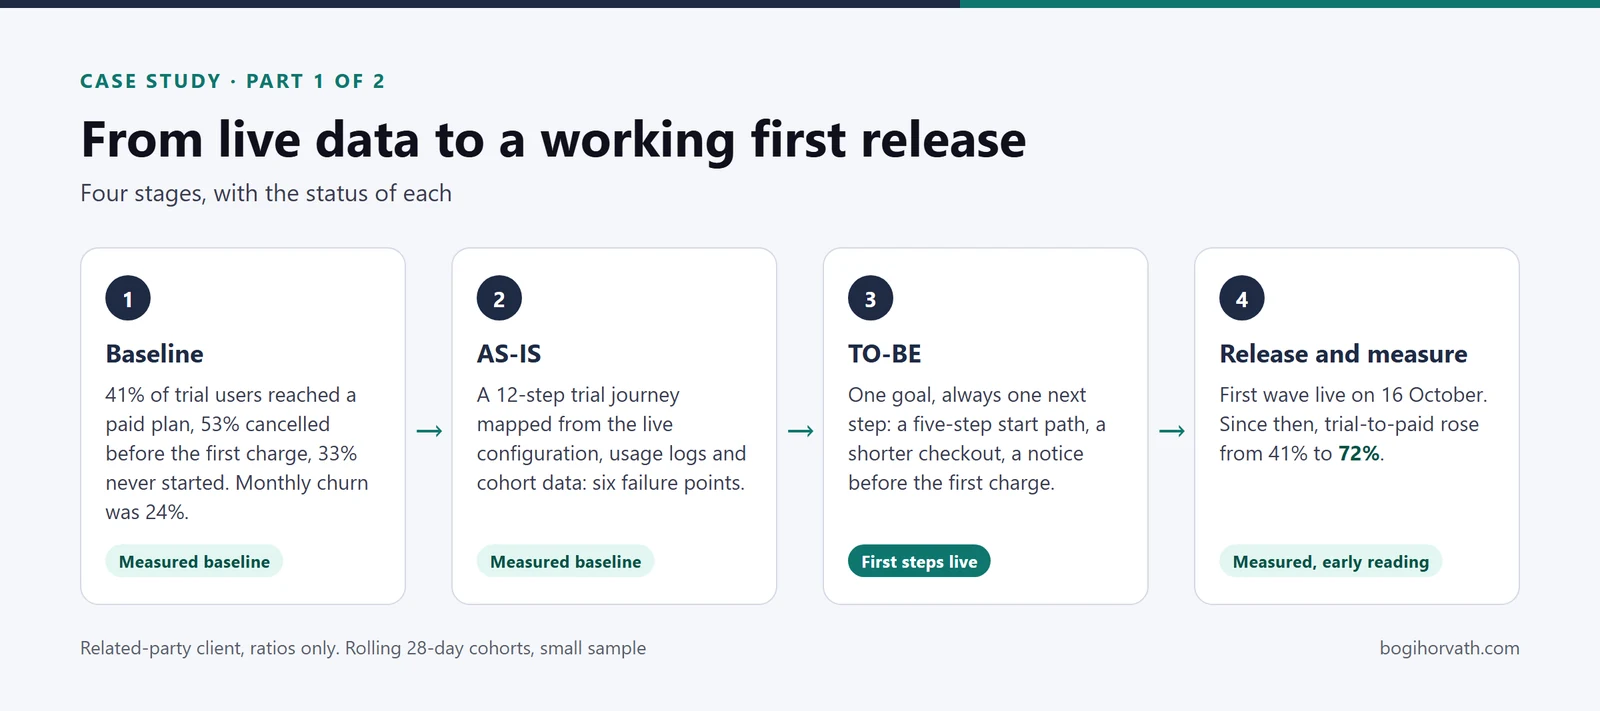
The company sells through a trial that turns into a paid plan at the first charge. The live data showed a funnel losing people at every stage: 41% of trial users reached a paid plan, 53% cancelled before the first charge, and 33% never started using the product. Monthly churn was 24%.
At that churn level, more advertising would mostly have refilled a leaking funnel. So I narrowed the work to two questions: where exactly does the journey lose people, and what can be fixed first without a development project?
Where AI sped up the analysis
I used classic business analysis methods: a baseline, a funnel model, a KPI framework and an AS-IS journey map. AI shortened the preparation of each (Figure 1). The diagnosis took two working days and the onboarding redesign two more. It shortened the preparation, not the checking: every output was reviewed before it fed a decision.
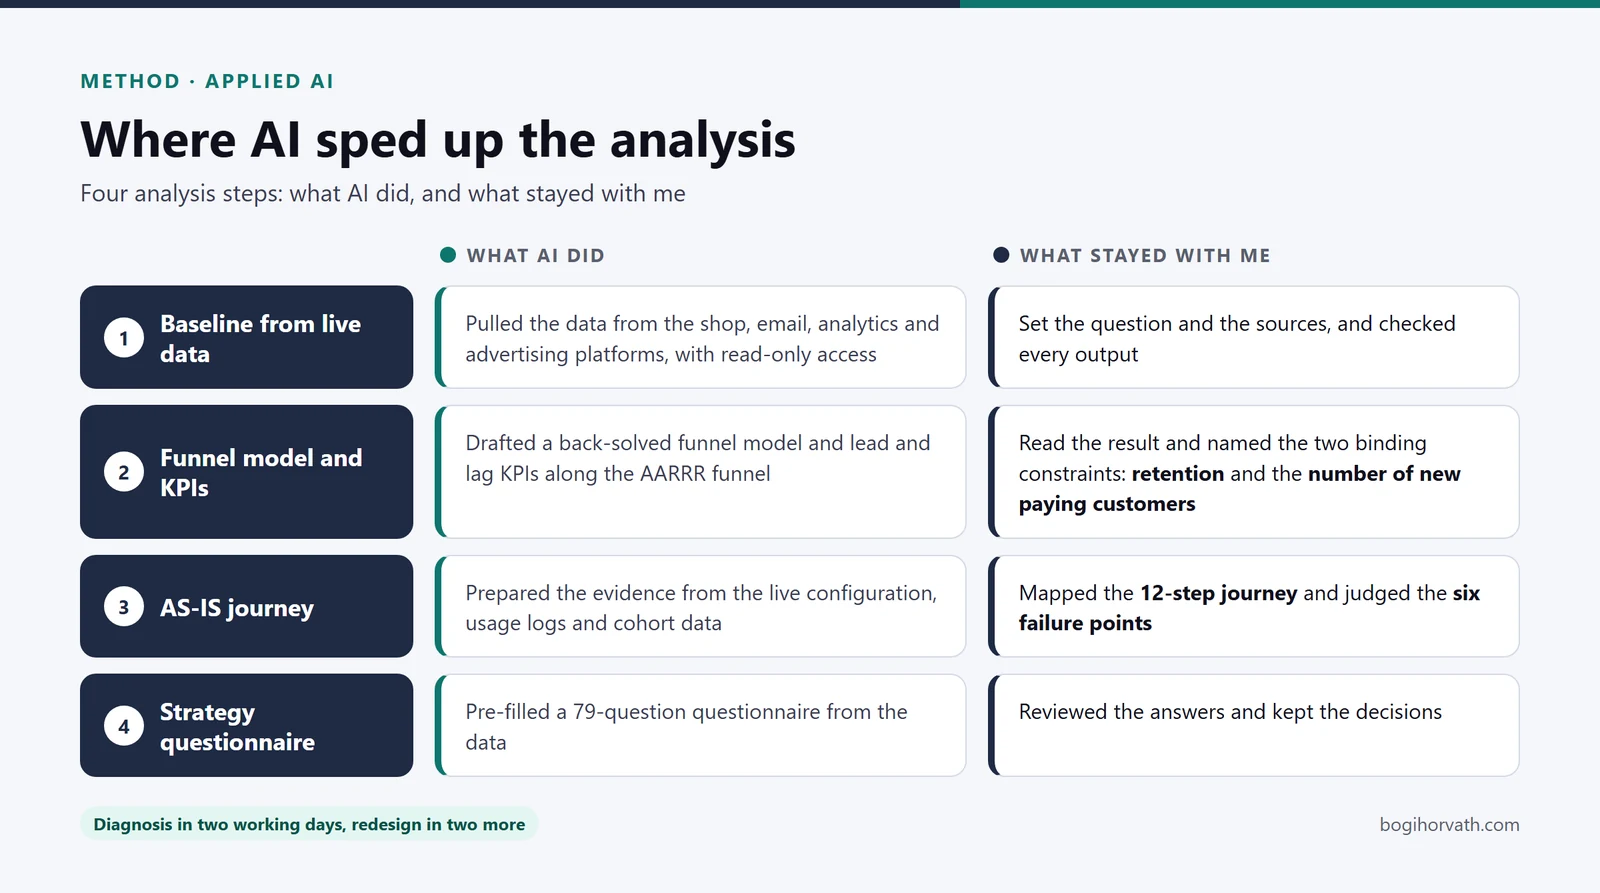
Before the first data pull I set the ground rules: which sources the AI could read (read-only access to every one), what it must not extract (no personal data) and who approves what (a person signs off every customer-facing change). With those in place, the AI could work at speed on the pulls and first drafts, and I checked every output.
Where the analyst still decides
The TO-BE design is the part an AI cannot hand over, and it is where experience counts most. My principle was one goal, and always one clear next step for the user. In practice, that meant a five-step start path, a checkout cut from seven fields to four, emails driven by the user's progress, a notice before the first charge and a recorded reason for every cancellation. I also redefined activation: it no longer means signing up, but completing the first audit of one's own business.
Then I sorted every TO-BE step into a rule, an agent step or a human decision (Figure 3). Most of the new journey needs no AI at all, because a rule or a standard trigger does the job more cheaply and more predictably. I kept AI for the steps where it adds value, with a person checking its output.
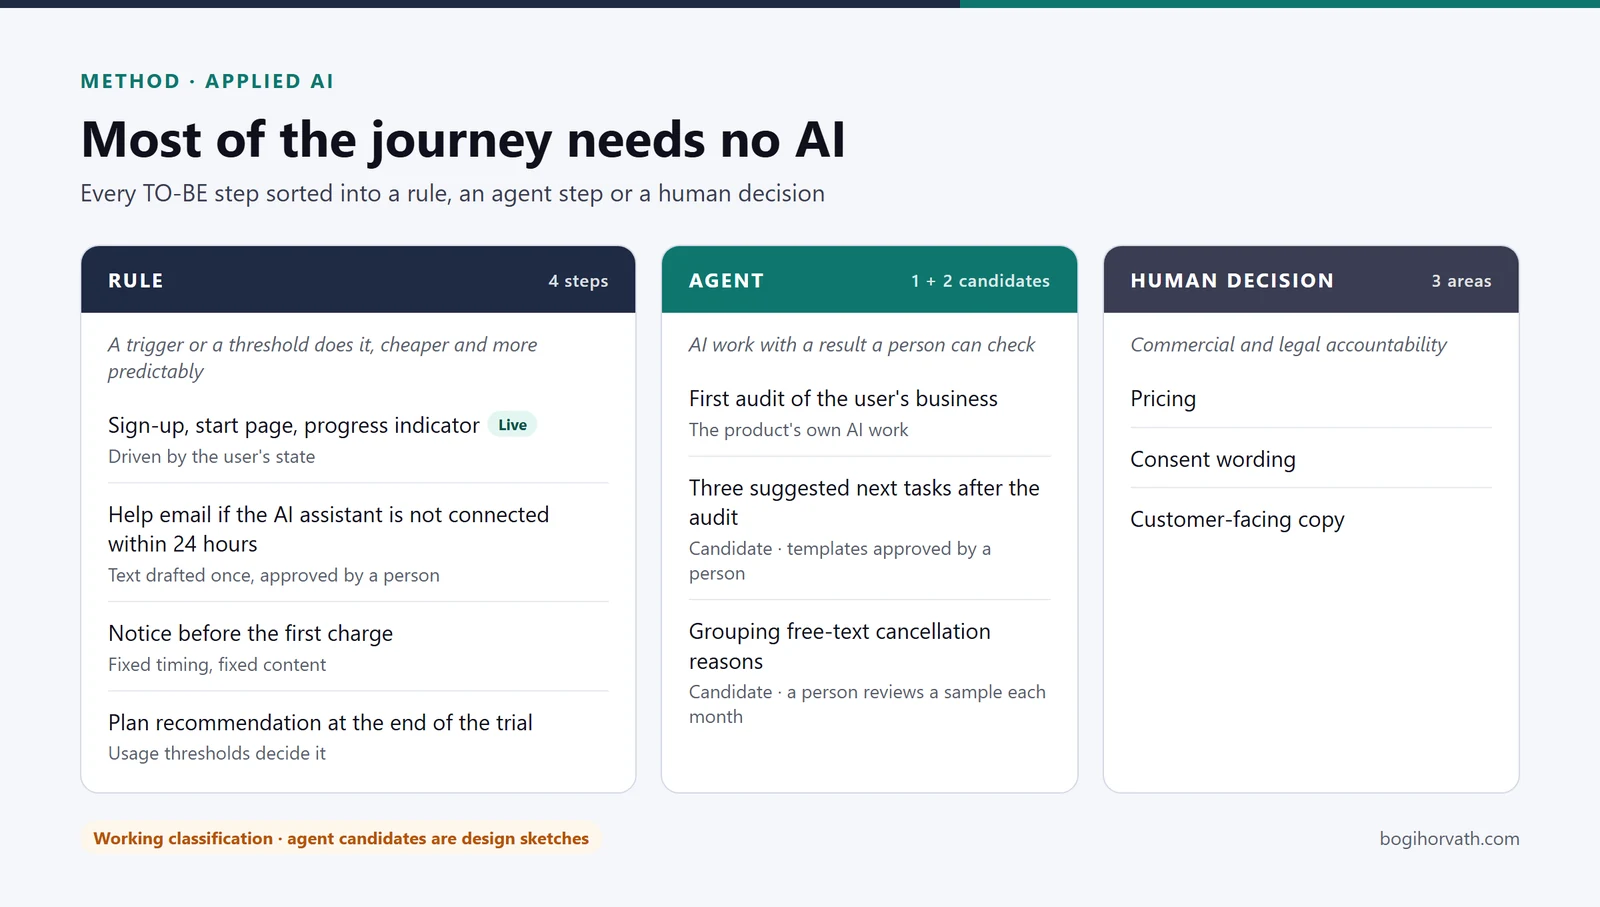
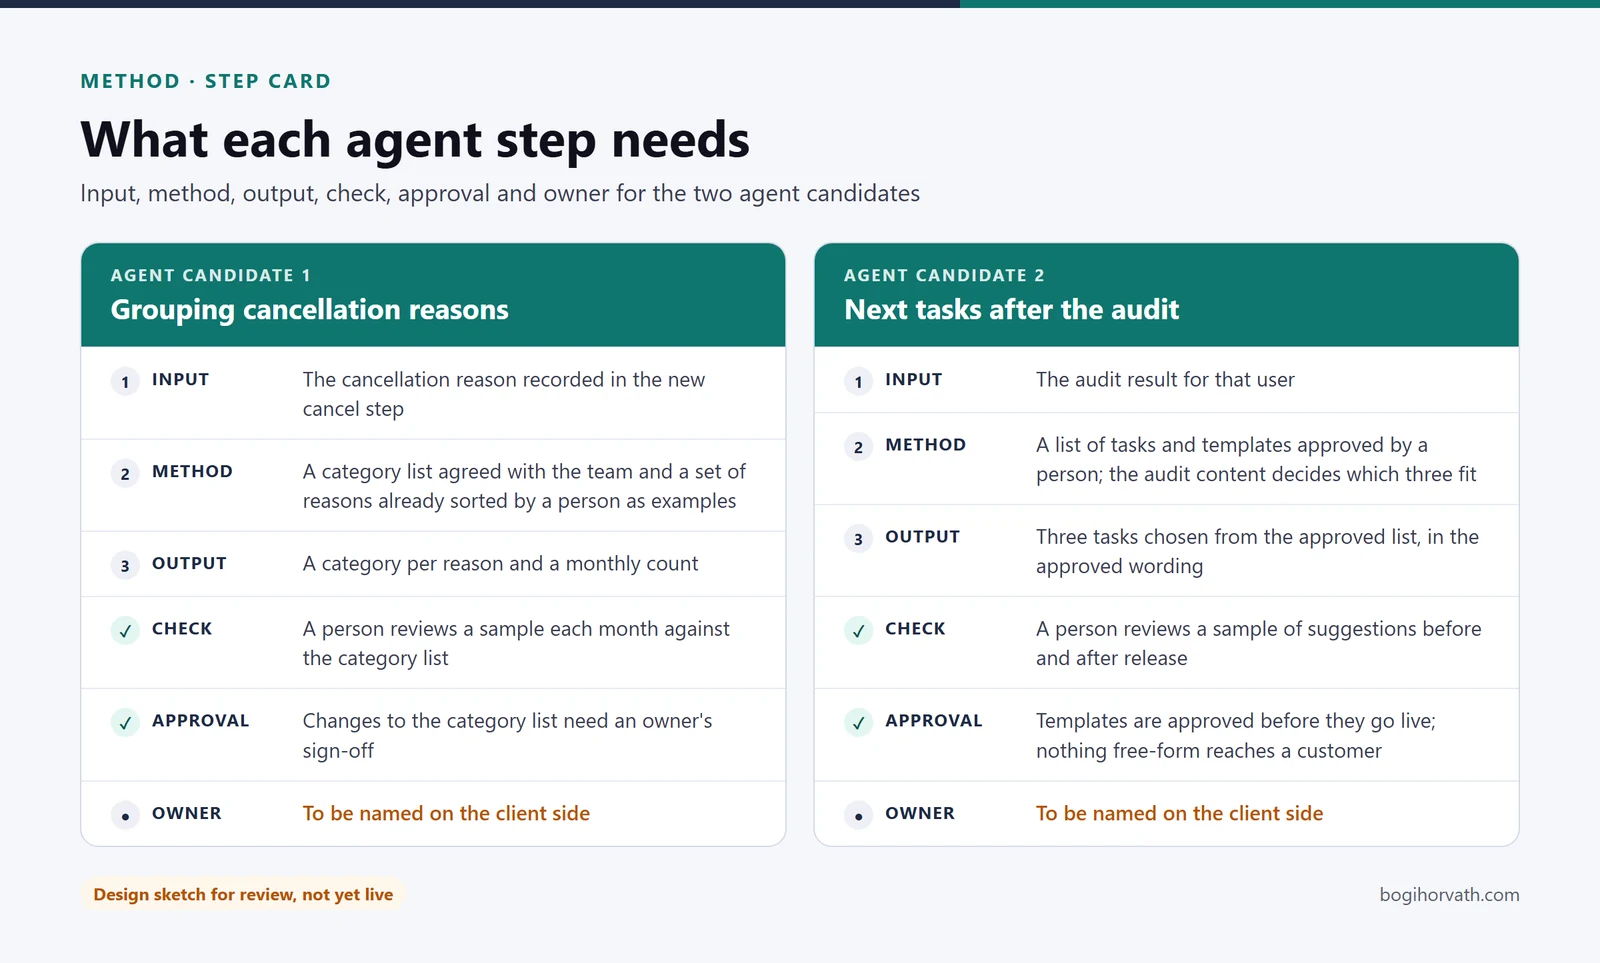
For the two agent candidates I wrote a step card (Figure 4): what goes in, how the step works, what comes out, who checks it and who signs it off. Both are design sketches and not live yet.
From analysis to a release plan
I matched the pace to the risk. The first wave changed only what a new user sees after signing up: no code, no change to payment, and easy to reverse, so there was no reason to wait. The changes that carry risk, the shorter checkout, the cancel step and the agent steps, go through testing and sign-off first, and the full switch-on waits for a test sign-up. Moving fast on the safe part meant the riskier decisions could rest on live data instead of assumptions.
I split the rollout into four waves over eight weeks, each with its own KPI targets. The first wave changed content only, so it needed no code, and it went live on 16 October. The other waves were approved in early November and are rolling out step by step. Alongside the plan I delivered the baseline and funnel model, the AS-IS and TO-BE maps, a gap analysis, a six-screen UX concept, a four-slide executive summary and a 16-slide detailed deck.
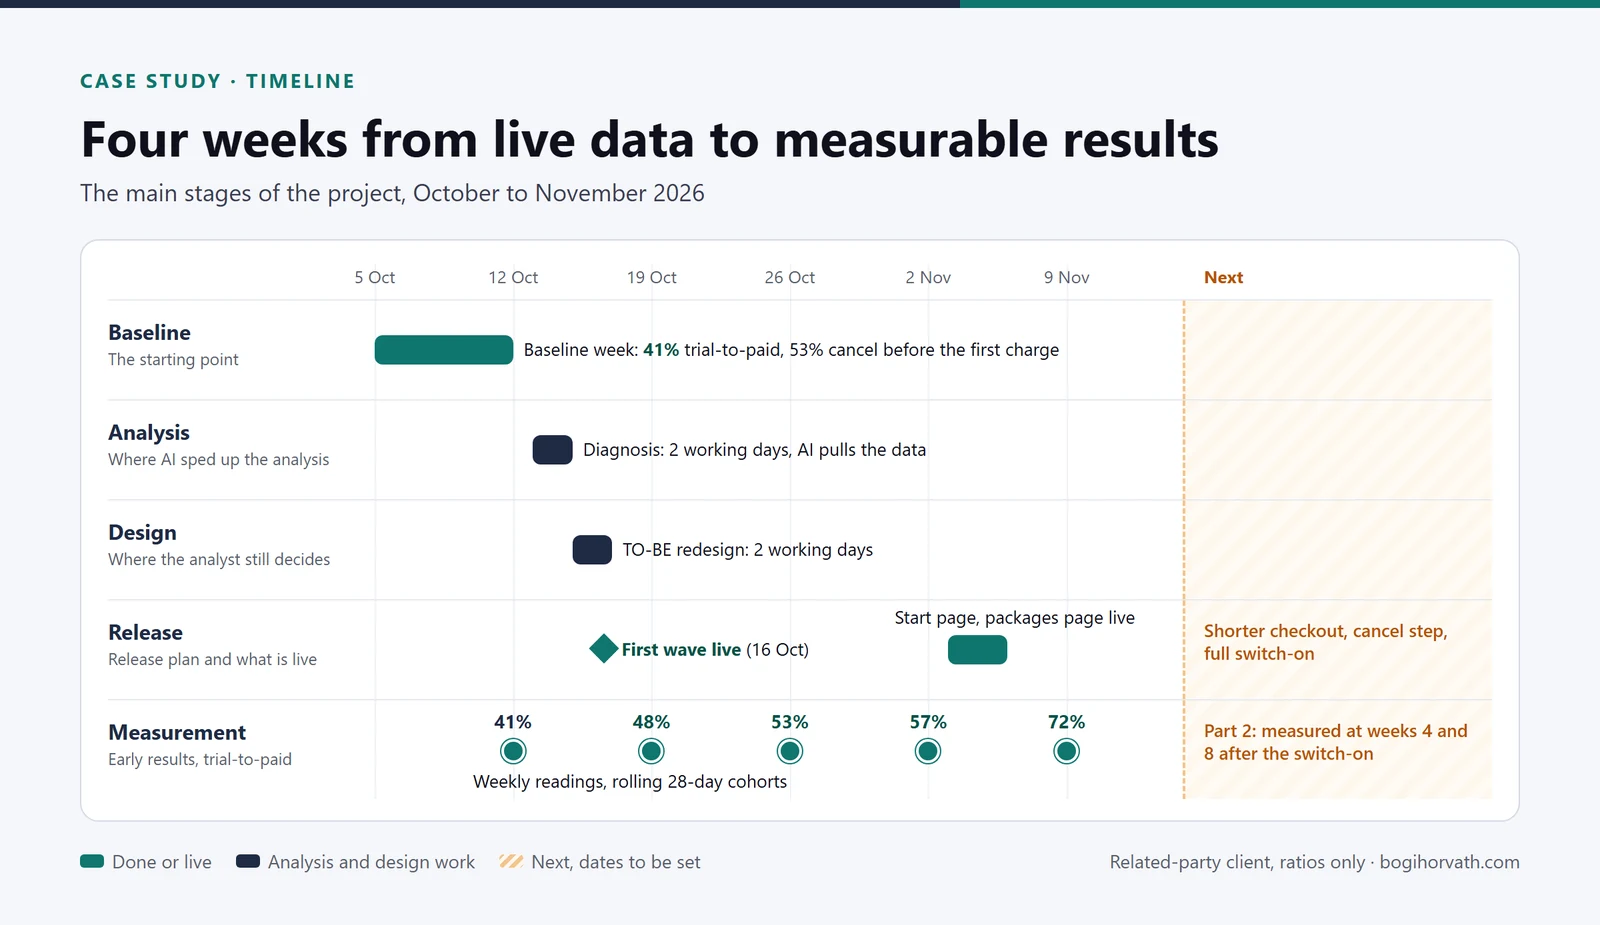
Every measurement uses the baseline definitions. In PDCA terms, the baseline and the design are Plan, the rollout is Do, the measurements at weeks 4 and 8 after the full switch-on are Check, and any change to the plan after week 4 is Act. Figure 5 shows the timeline.
What is live so far
Three steps are live, and I had each one checked before the next one started:
- 16 October, the content-only first wave. The thank-you page after sign-up now leads straight to connecting the AI assistant. The connection lesson works as a launchpad, and all three connection paths lead to a new seven-part lesson in which users audit their own business, make small fixes and see how to move to a larger plan.
- Early November, a start page for signed-in users: the five-step start path with a progress indicator. Users can mark a step as done, and the bar disappears once the path is complete.
- Early November, a packages page: a calculator recommends the cheapest plan that fits, and a plan change runs step by step.
Still ahead: the shorter checkout, the new cancel step that asks for a reason, and the full switch-on after a test sign-up.
Early results: more trial users become customers
AI pulled the weekly figures in minutes, using the baseline definitions. Each figure covers the trials that ended in the previous 28 days, so week by week the trials from before the first wave drop out and trials that went through the new flow take their place (Figure 6).
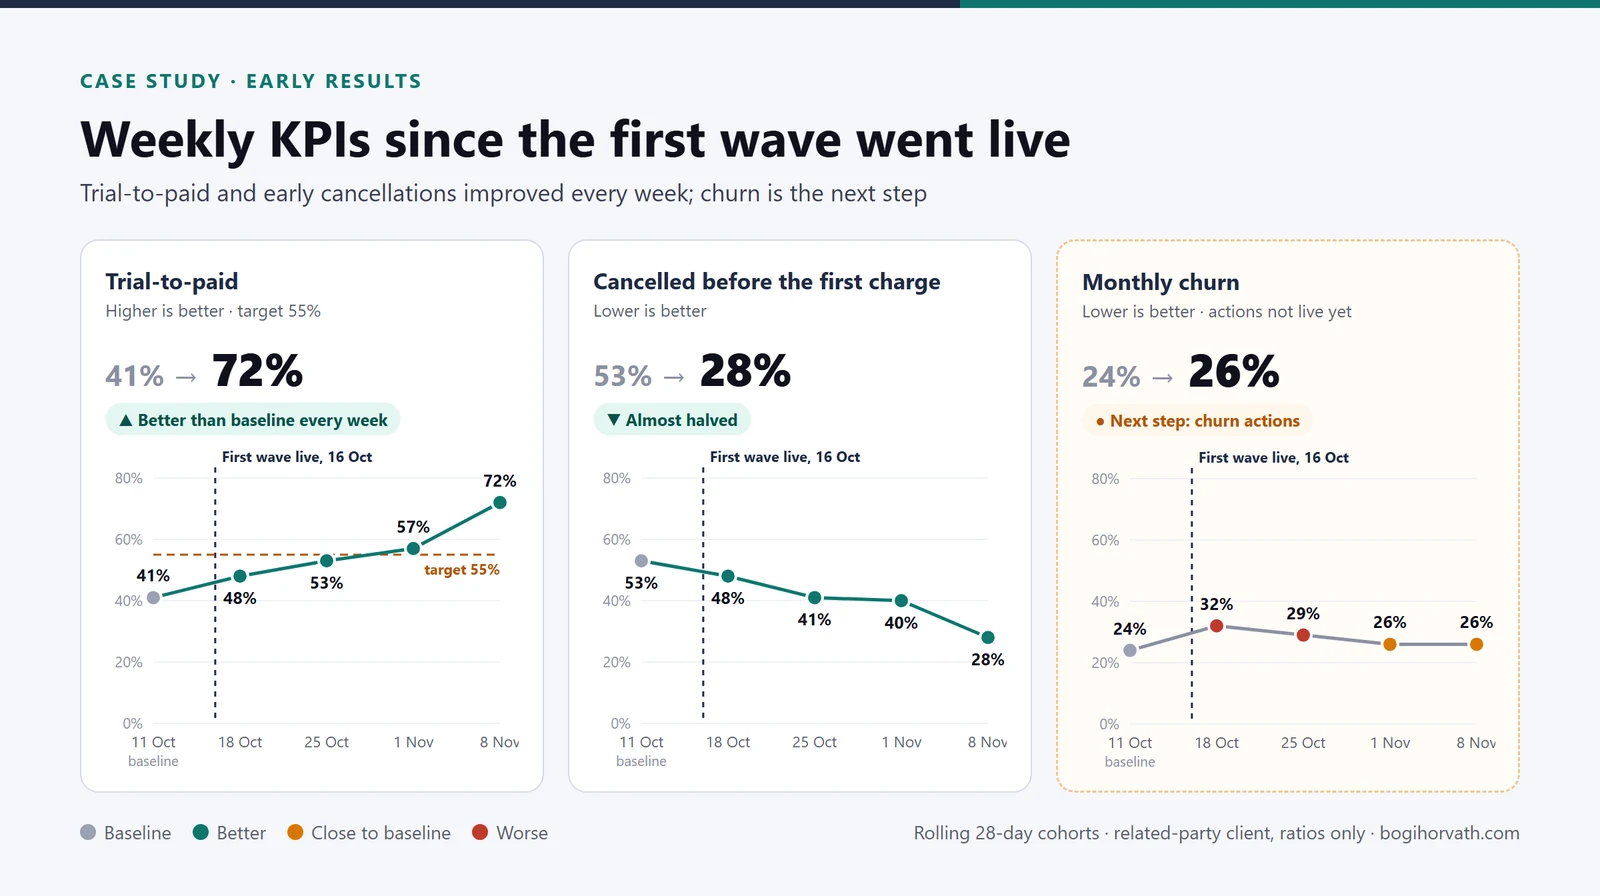
The results line up with the release. Before 16 October, 41% of trial users reached a paid plan. The ratio has risen every week since, to 72% in the week to 8 November, well above the 55% target. Over the same weeks, cancellations before the first charge almost halved, from 53% to 28%. Both gains sit in the part of the journey the first wave changed: what a new user sees and does right after signing up.
Next step: monthly churn. Churn is a KPI in the plan, but the first wave did not target it, and the actions for keeping paying customers are not live yet.
The sample is still small. Before the full switch-on I will fix a new baseline with the same definitions, and Part 2 will measure the whole redesign against it.
What this shows
Fast, measurable results are possible when experience and AI work on the same problem. The methods gave the project its structure. AI made each step fast enough that decisions could rest on evidence within days. Speed here meant earlier evidence, not skipped steps: the same methods, the same checks, with AI taking over the pulling and drafting. My experience decided where to look, what to change first and what to leave to a rule instead of an AI. Less than four weeks after the first data pull, more trial users are becoming paying customers, and cancellations before the first charge have nearly halved.
This is how I work as a senior business analyst and AI-enabled process transformation lead: I break the work into steps, give the AI what each step needs and keep the decisions where the accountability sits. It is early and the sample is small, but so far the approach is working, and the direction is clear.
The first wave showed what the trial process redesign can do for conversion. Part 2 will test the rest: the week 4 and week 8 results after the full switch-on, and the first read on churn.
Want the full playbook behind this?
14+ years of results, EUR 1.1M+ documented savings. Senior Business Analyst & AI-Enabled Process Transformation Lead. 2 pages, no signup.